By Bob West
The up-and-down nature of California farmers’ challenges created particularly tough conditions in the early part of this summer after an up-and-down Spring, according to the latest data from Meister Media’s PURE Intel™ platform.
PURE Intel+ and PURE Intel+ PCA (patent pending) provide subscribers with tremendous insight into the California agriculture activity by aggregating farmers’ monthly pesticide use reports from all 58 counties and providing subscribers with the tools to analyze that data through a range of customizable filters.
The July data update provides the first look at numbers for the first half of 2022 vs. the previous years, and the data indicates a reduction in the number of growers applying restricted-use products (RUPs) this year, fewer total applications being made, and fewer total treated acres.
The number of growers reporting RUP applications in the first half of the year has steadily declined over the past five years (although the drop is much less significant when you look at data for an entire calendar year.
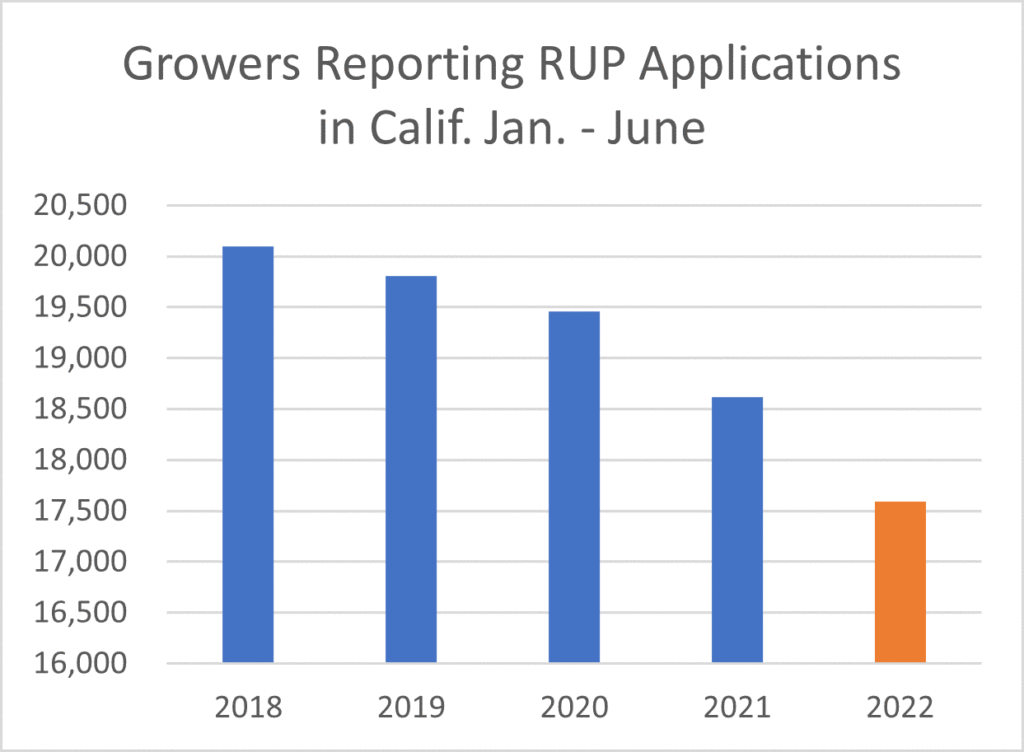
American Fruit Grower Editor Dave Eddy said the declining number of farms can be largely attributed to drought. “Smaller and medium-sized growers have been disappearing for years around the country because of economies of scale, but it’s been greatly accelerated in California by the drought,” says Eddy. “Water will flow to the growers who can most efficiently irrigate the most profitable crops, so smaller farms, especially those with less-than-optimal crops like canning tomatoes, are selling to their larger neighbors, who often farm crops like almonds. In other words, though this trend has been going on for a number of years, the drought has sent it into hyperdrive, and there’s every reason to believe it will continue, or more likely, accelerate, until the drought ends.”
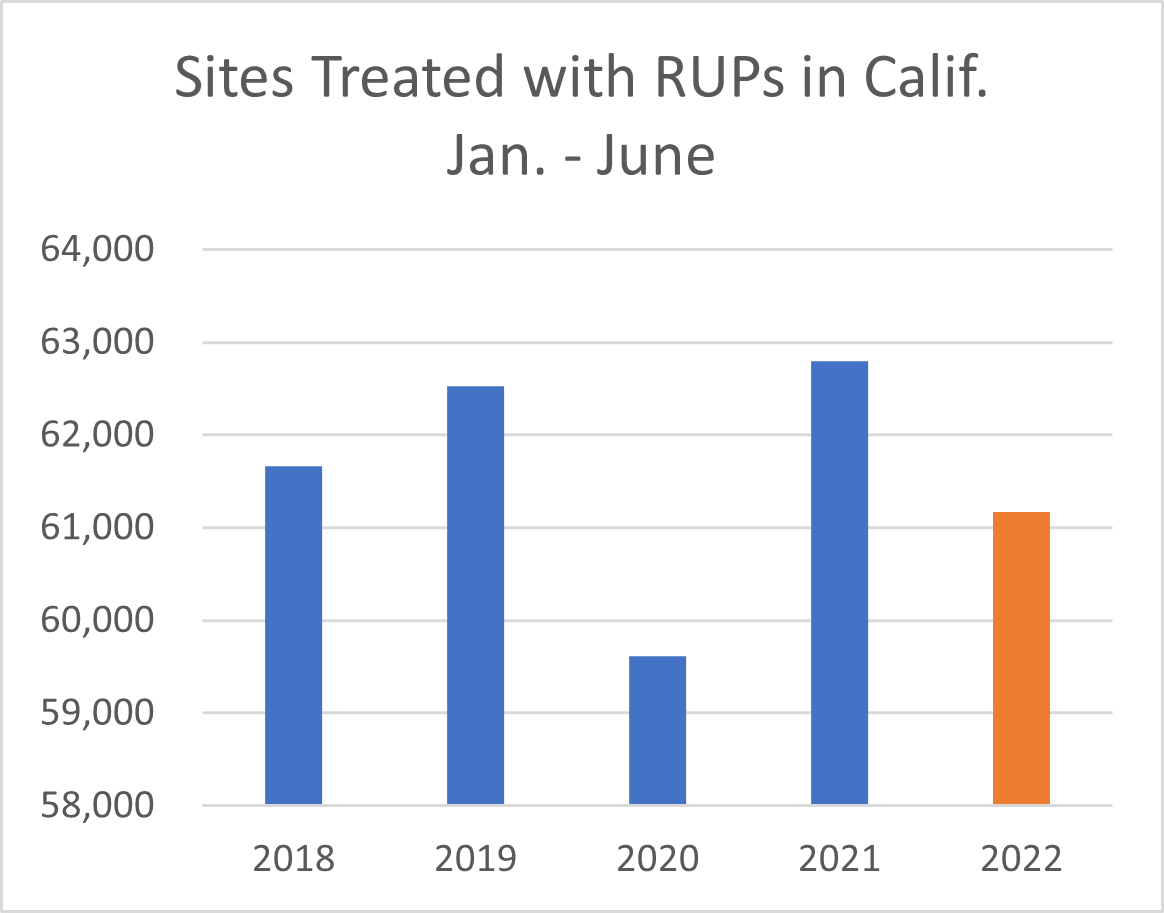
Despite the drop in the number of growers reporting RUP applications, the total number of sites being treated across the state remains comparable to 2018 levels, which speaks to Eddy’s point about consolidation – many farm operations are simply expanding their operation and controlling more sites than ever.

Of greater concern to suppliers selling crop protection products to California’s farmers is the decline in the number of applications reported through the first half of the year. Farmers report making roughly 6% fewer applications in the first half of 2022 vs. the first half of 2021 after an 8% reduction from 2020 to 2021.
Increasing use of biopesticides, which are often not classified as RUPs and exempt from reporting, and reduced disease pressure during drier summers can account for some of this decline. But the big picture is obviously that farms have reduced pesticide applications in recent years as water issues, labor challenges, softening market conditions and other obstacles have reduced production.
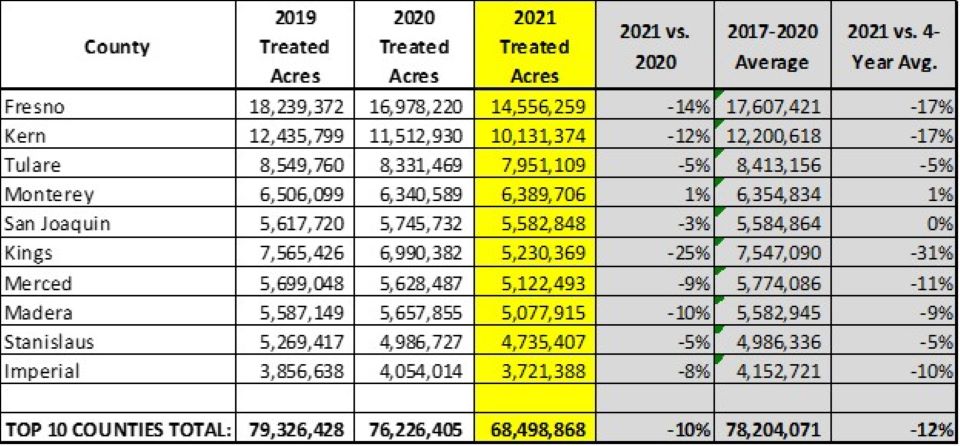
The reduced application activity can be found throughout the state. Total treated acreage looks to be down through the first half of the year in six of the state’s top 10 ag counties.
|
County |
Treated Acreage Jan. – June 2022 vs. 2021 |
| Kings | 21% |
| Kern | 15% |
| Monterey | 9% |
| Imperial | 4% |
| Tulare | -2% |
| Madera | -5% |
| Fresno | -11% |
| Merced | -12% |
| Stanislaus | -16% |
| San Joaquin | -24% |
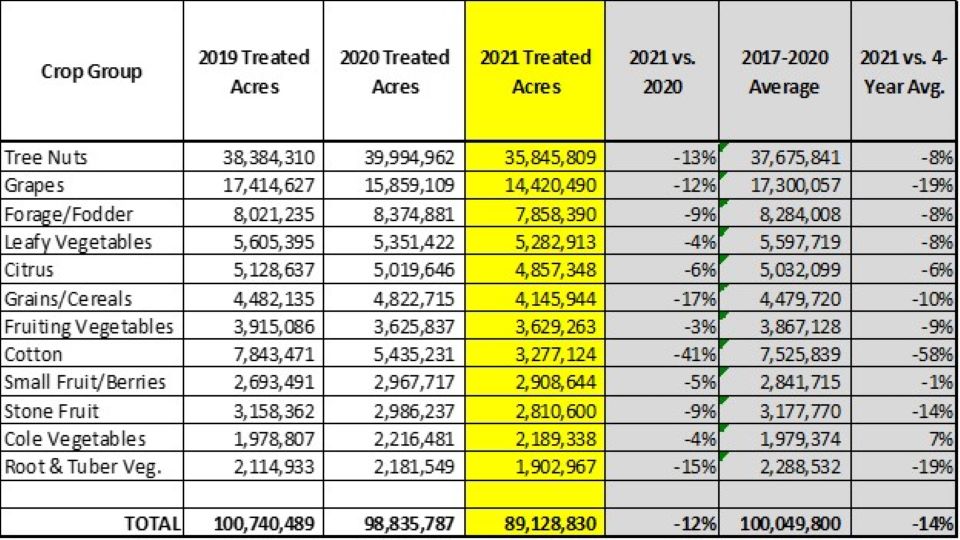
PURE Intel enables users to view applications by the crop treated, and it’s not a surprise that year-over-year declines can be seen across most crops. Again, declines for January – June can be found in seven out of the top 10 crop groups.
|
Crop Group |
Treated Acreage |
| Grains/Cereals | 20% |
| Cotton | 16% |
| Stone Fruit | 3% |
| Citrus | -1% |
| Grapes | -3% |
| Forage/Fodder | -5% |
| Leafy Vegetables | -6% |
| Tree Nuts | -10% |
| Small Fruit/Berries | -11% |
| Fruiting Vegetables | -28% |
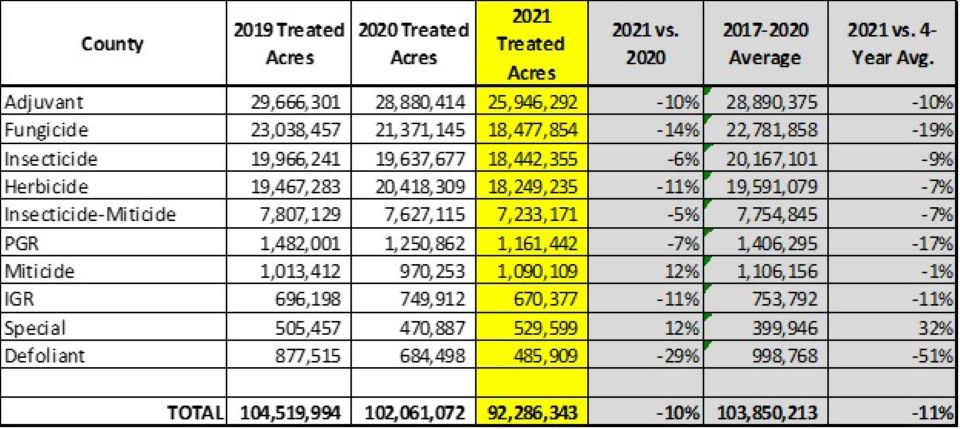
California farmers applied more than than 2,850 different brands of control products to the state’s farms in the first six months of 2022, and PURE Intel+ shows us just how much of every brand is applied. Treated acreage looks to be down for all of the key categories of RUPS thus far in 2022, although insecticides, miticides and plant growth regulators have fared better than other product types thus far.
|
Product Type |
Projected Treated Acres (Jan. – June) |
Change from |
| Adjuvants | 13,400 | -4% |
| Fungicides | 11,761 | -8% |
| Herbicides | 10,050 | -9% |
| Insecticides | 8,520 | -1% |
| Insecticides-Miticide | 3,261 | -11% |
| Plant growth regulators | 510 | -2% |
| Insect growth regulators | 505 | 21% |
| Miticides | 443 | 2% |
| Special products | 323 | 98% |
| Defoliants | 155 | -4% |
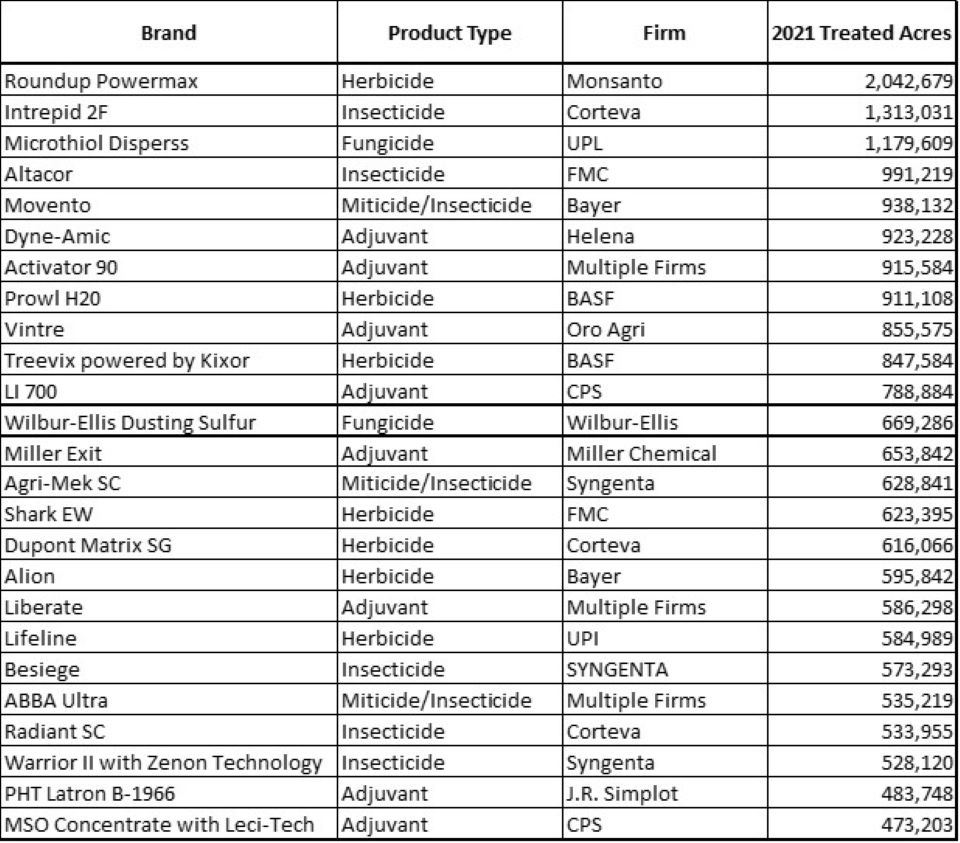
The PURE Intel data can be used to identify application activity and volume by specific brand, which provides insights such as which products are being used most often across the state. Here’s a summary of the five most widely applied brands (ranked by treated acreage) applied in the first half of 2022 for each of the key product categories.
| Adjuvants | Fungicides | Herbicides | Insecticides | Insecticide-Miticides |
| Activator 90 | Microthiol Disperss | Roundup Powermax | Intrepid 2F | Movento |
| Dyne-Amic | Wilbur-Ellis Dusting Sulfur | Prowl H2O | Warrior II with Zeon Technology | Agri-Mek SC |
| LI 700 | Merivon | Treevix Powered by Kixor | Asana XL | AbbA Ultra |
| Vintre | Fontelis | Matrix SG | Radiant SC | Minecto Pro |
| PHT Latron B-1956 | Manzate Pro-Stick | Alion | IAP Summer 415 Spray Oil | PHT 415 Supreme Spray Oil |
Bob West is the Direct of Meister Media’s data business. For more information about this data or for more details about their PURE Intel+ and PURE Intel+ PCA business, contact him at 440-602-9129 or [email protected].
PURE Intel is a trademark of Meister Media Worldwide. PURE Intel+ PCA is patent pending.